This translation is older than the original page and might be outdated. See what has changed.
Sidebar

en:vscode:debugger
Table of Contents
How to use debugger in VSCode
A Debugger is a tool that supports you to debug a program.
It allows you to check the status of variables or use what's called stepwise execution to follow the behavior of a program… It allows you to debug much efficiently than using print() to debug.
1. VirtualCast Settings
You need to write “TCP port number for VCI script debugger”: 41912 in the VirtualCast Settings >VCI .
2. Adding debugger plug-in on VS Code (VScode)
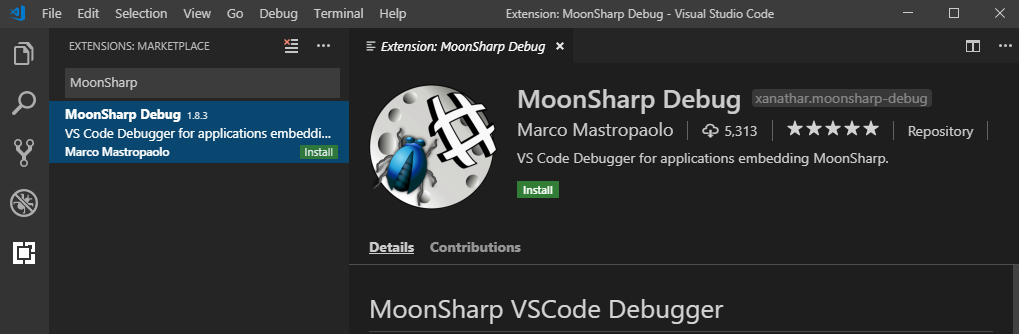
After launching VS Code, select [Extensions] from the tab on the left, and in the search box type [MoonSharp].
Click on [MoonSharp Debug] from the search result to open the page and click [Install] to install the plug-in.
3. Create launch.json in the VS Code workspace (VS Code)
To use the VS Code debugger on Virtual Cast…
You need to create a folder for [.vscode] right under the [EmbeddedScriptWorkspace] folder, then inside the newly created folder, create [launch.json]. ([launch.json] is the settings file for the debugger)
1. Open the [EmbeddedScriptWorkspace] folder
C:/Users/__USER_NAME__/AppData/LocalLow/VirtualCast/VirtualCast/EmbeddedScriptWorkspace
Replace __USER_NAME__ with your PC's user name.
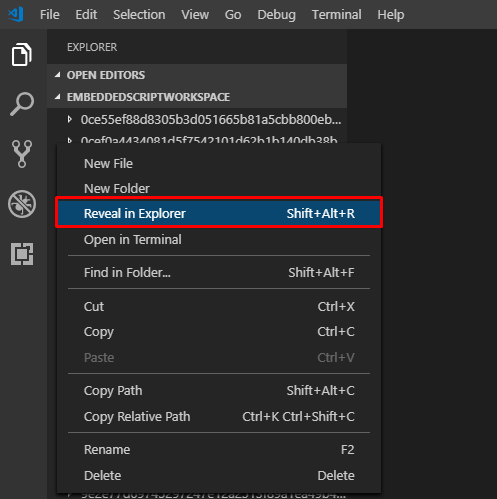
If the [EmbeddedScriptWorkspace] folder is already open in VS Code…
On the workspace of VS Code, right-click to open the menu and click on [Reveal in Explorer] to open the folder.
2. Create a folder named [a.vscode] in the [EmbeddedScriptWorkspace]
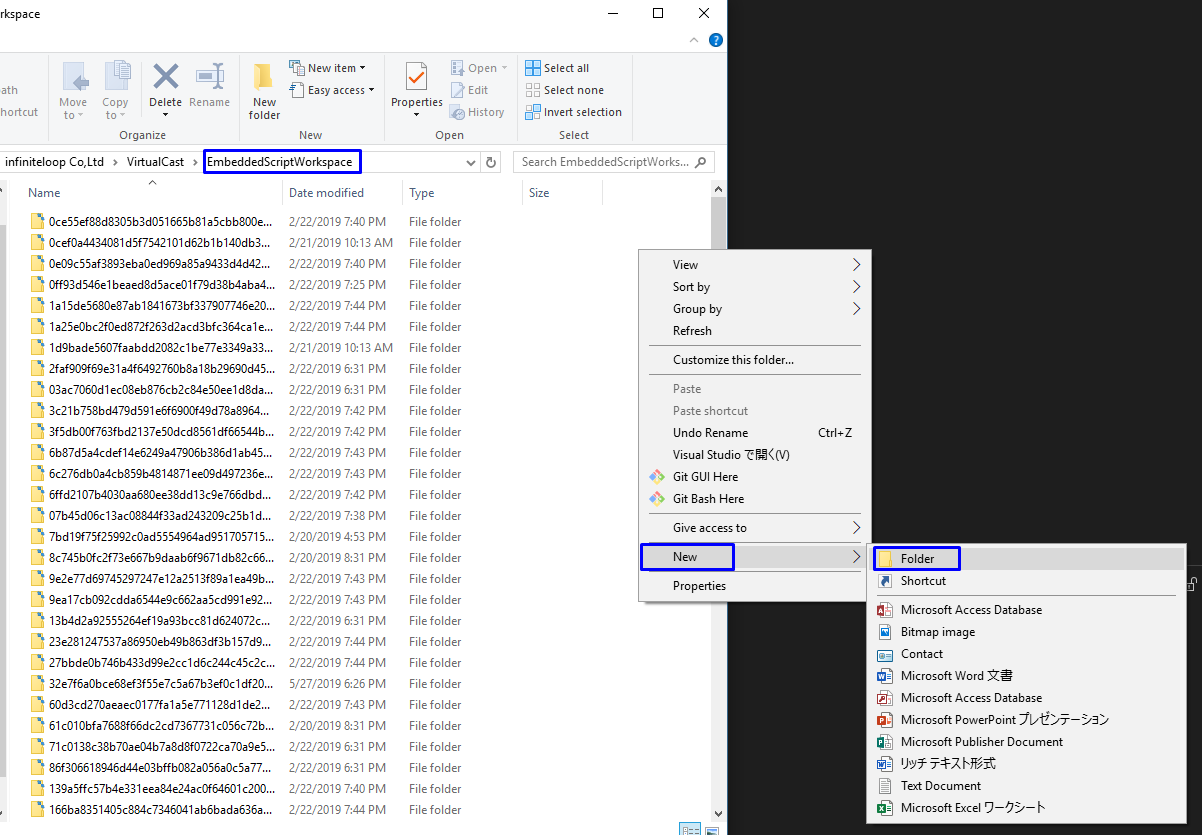
Create a folder named [a.vscode] right under the folder [EmbeddedScriptWorkspace].
Trying to directly create a folder [.vscode] will cause an error.
To debug the script, tick on [Script Enable Debugging] checkbox during export.
3. Launch Command Prompt
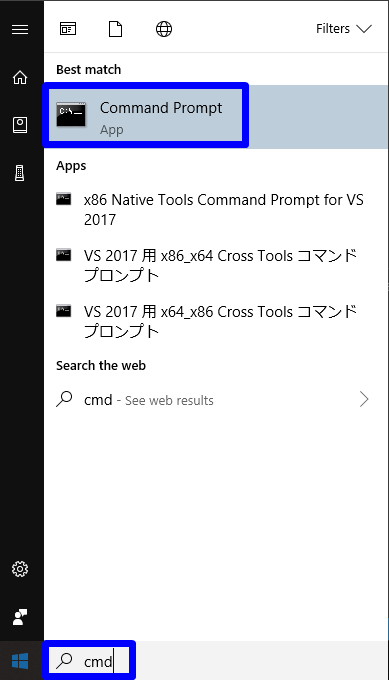
In the search box at the bottom left corner of the desktop, type “cmd” to find the Command Prompt in the search result.
Launch Command Prompt from there.
4. Edit the folder name from Command Prompt
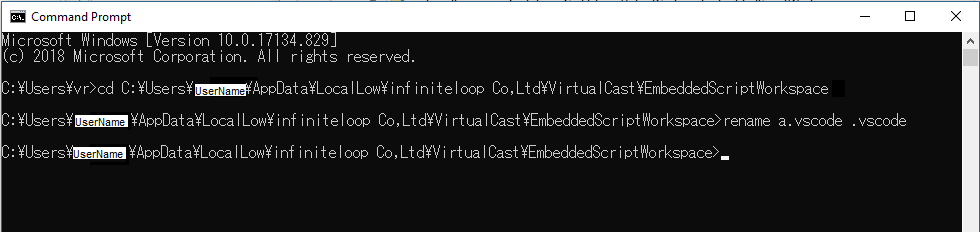
cd C:\Users\__USER__\AppData\LocalLow\VirtualCast\VirtualCast\EmbeddedScriptWorkspace
In the Command Prompt, enter the command above to open the [EmbeddedScriptWorkspace] folder.
It is a good idea to copy the file path from the Explorer with the [EmbeddedScriptWorkspace] open.
Replace USER with your PC's user name.
rename a.vscode .vscode
Next, use the command “rename” to rename the folder [a.vscode] to [.vscode].
After you have done above, check the folder to see if the name is changed to [.vscode].
5.Create [lanuch.json] inside the [.vscode] folder
In the [.vscode] folder, right-click to open the context menu and…
select [New] > [Text Document] to create a text file, then rename it to “launch.json”.
OR, you can download the [launch.json] file from below and save it in the [.vscode] folder.
6. Copy and paste the text below into [launch.json]
launch.json
- launch.json
{
    "version": "0.2.0",
    "configurations": [
        {
            "name": "MoonSharp Attach",
            "type": "moonsharp-debug",
            "request": "attach",
            "debugServer": 41912,
            "HELP": "Please set 'debugServer':41912 (or whatever port you ar connecting to) right after the 'version' field in this json."
        }
    ]
}
Open the [launch.json] file you just created and copy and paste the text above, then save.
FYI: The official reference have “debugServer”: 41912, written in the wrong place.
The [launch.json] above has it in the right place.
MoonSharp Debug
4.Steps to using the debugger
Import a VCI that includes a script into Virtual Cast
1. Upload a VCI with VCI script included.
2. Launch Virtual Cast and connect account.
Run in Virtual Cast
How to use the debugger
First, launch Virtual Cast and enter into a studio, then spawn the VCI to debug.
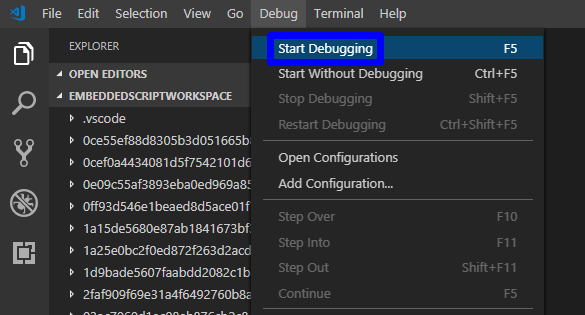
After that, in VS Code, launch debugger from [Debug] > [Start Debugging].

You can set breakpoints by clicking on the left of line numbers.
A breakpoint is a point at which the program will pause when scripts up to the line with the point is ran.
On the example above, breakpoints are set inside the onGrab() function. Go back into the studio and grab the VCI.
After grabbing the VCI, you normally expect to see three “print()” executed, but they are not.
By using stepwise execution from the debugger tool in VS Code, you can execute the program step-by-step.
To end the debug tool, click on the red plug icon on the right.
By using the debug console and the left-side bar showing the status of variables, you can track after small details that might be hard to track by just using print().
en/vscode/debugger.txt · Last modified: 2023/10/24 19:12 by pastatto